
The NCAA tournament’s first Friday delivers four opening-round matchups spread across three time zones, each presenting distinct market structures. From the thin-margin 7-10 game in St. Louis to the historical outlier in San Diego, these lines reward precise calibration of pace, defensive efficiency, and the structural value of neutral-site tournament underdogs. The slate moves from competitive spreads to blowout territory, with market participation likely heaviest where public teams anchor the board.
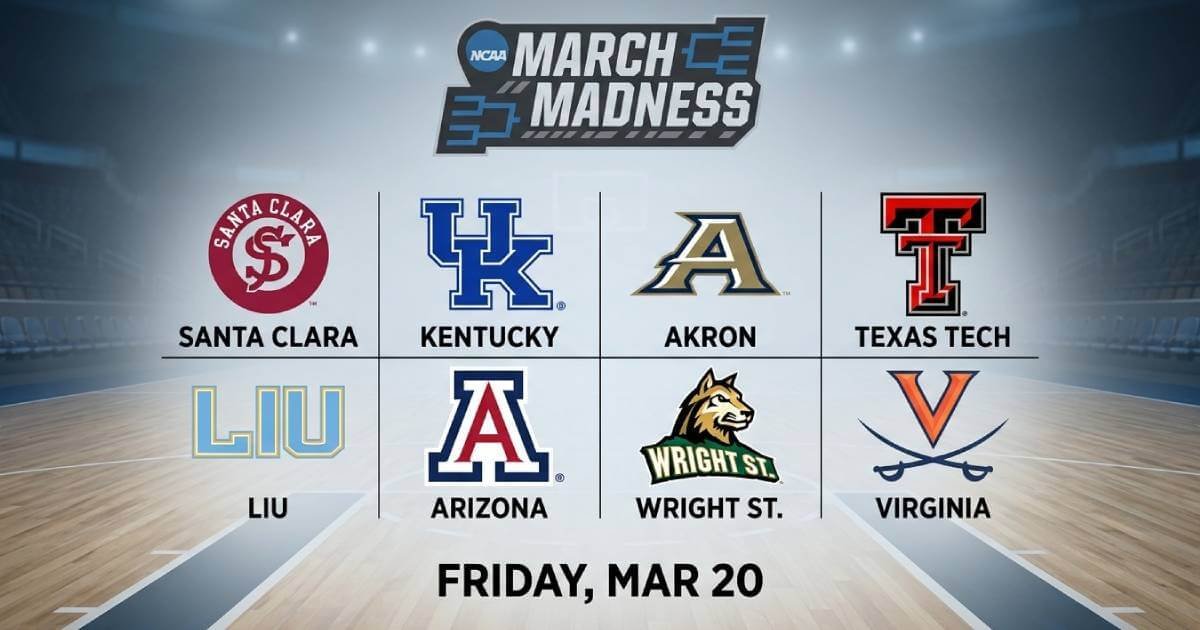
Santa Clara Broncos @ Kentucky Wildcats
Market Breakdown & Analysis:
The tightest spread of the early slate reflects genuine matchup uncertainty. Kentucky enters at 21-13 against Santa Clara’s 26-8, but the Wildcats’ Southeastern Conference schedule and the Broncos’ West Coast Conference runner-up status create competing claims on quality. The 3.5-point spread with a total of 157.5 generates a high-possession expectation: the math implies approximately 78 possessions per team if efficiency holds neutral.
Santa Clara’s offensive efficiency advantages are material. The Broncos averaged 82.9 points on 47% shooting against Kentucky’s 80.8 on 46%, with Christian Hammond’s 15.8 points per game providing balanced scoring against Otega Oweh’s 18.2 for the Wildcats. The rebounding differential favors Kentucky (41.1 to 38.8), though this narrows in neutral-site conditions where home-court rebounding advantages dissipate.
The total sits at 157.5, an aggressive number that prices both teams as above-average offensively. Kentucky’s defensive efficiency in the SEC tournament showed vulnerability: consecutive losses to Florida (84-77, 71-63) and Texas A&M (96-85) featured defensive breakdowns. Santa Clara’s 76-71 win over Saint Mary’s on March 10 demonstrated tournament-caliber execution against a quality opponent.
Santa Clara’s 15-3 conference record and losses to Gonzaga (79-68) and Saint Mary’s (86-67) provide a form baseline not too distant from Kentucky’s 10-8 SEC mark and six conference losses in the final 10 games. The market’s 58% win probability for Kentucky appears compressed by brand recognition.
Value Pick: Santa Clara Broncos +3.5 (-119)
Akron Zips @ Texas Tech Red Raiders
Market Breakdown & Analysis:
The 7.5-point spread represents a structural test of conference strength assumptions. Texas Tech’s 22-9 record in the Big 12 faces Akron’s 26-5 MAC dominance, with efficiency metrics that reverse the expected narrative. Akron’s offensive efficiency of 1.192 exceeds Texas Tech’s 1.154, while defensive efficiency favors Akron as well (1.022 to 1.043).
The spread-to-total ratio generates a possession premium calculation: Texas Tech must win by more than 4.8% of the total points expected. With a total of 155.5, the implied final score approaches 82-74 if chalk holds. Akron’s 89.6 points per game average and 58.5% effective field goal percentage suggest offensive sustainability against tournament competition.
Tavari Johnson’s 20.2 points per game on 51.7% shooting provide Akron with a matchup problem against Texas Tech’s perimeter defense. The Red Raiders’ late-season form includes concerning defensive performances: an 82-65 loss to BYU, 76-53 loss to Iowa State in the Big 12 tournament. Texas Tech’s 12-6 conference record and five-seed tournament placement reflect a team that peaked early.
The total adjustment from an opening of 156.5 to 155.5 signals market correction toward defensive engagement. Both teams possess turnover generation capability (Akron 15.9% opponent turnover rate, Texas Tech 12.7%), suggesting a possession-constricted game that favors the underdog’s ability to stay within the number.
Neutral-site conditions in Tampa neutralize Texas Tech’s home-court advantages from the regular season. Akron’s 26-5 record includes a 15-2 road performance, indicating travel resilience. The 7.5-point spread exceeds the typical efficiency differential between these conferences, creating structural value on the MAC champion.
Value Pick: Akron Zips +7.5 (-109)
LIU Sharks @ Arizona Wildcats
Market Breakdown & Analysis:
The 30.5-point spread represents the largest margin on the tournament’s opening Friday, testing the structural limits of college basketball handicaps. Arizona’s 29-2 record and 16-2 Big 12 mark establish them as a legitimate championship threat; LIU’s 23-10 Northeast Conference title provides the automatic entry without corresponding quality metrics.
The spread-to-total ratio produces extreme mathematics: Arizona must win by more than 20% of the total points expected. With a total of 149.5, the implied final approaches 90-60. Arizona’s 86.7 points per game average and 50.2% shooting suggest offensive capacity to reach this threshold, though tournament history demonstrates that heavy favorites often substitute early and coast through second halves.
LIU’s statistical profile contains relevant tournament indicators: 74.1 points per game, 47.9% shooting, and 8.0 steals per game suggest a team capable of generating possessions through defensive activity. Jamal Fuller’s 16.6 points per game provide scoring infrastructure against high-major competition. The 23-10 record includes 15-3 conference dominance with quality wins over Central Connecticut and Wagner.
The total of 149.5 sits well below Arizona’s season average, pricing in pace reduction from tournament intensity and early substitution patterns. Historical 1-16 matchups average 12.4 points below the favorite’s season scoring average due to second-half margin management. This structural tendency favors the underdog spread in games where covering becomes mathematically less relevant than survival.
Arizona’s recent form includes tournament-pressure wins over Houston (79-74) and Iowa State (82-80) in the Big 12 tournament, demonstrating execution in close games rather than blowout dominance. The 30.5-point spread assumes motivational continuity that championship contenders often lack in opening rounds.
Value Pick: LIU Sharks +30.5 (-109)
Wright St Raiders @ Virginia Cavaliers
Market Breakdown & Analysis:
The 18.5-point spread and 145.5 total create a Virginia-specific market structure: the Cavaliers’ defensive reputation prices totals lower than raw efficiency suggests. Wright State’s 80.2 points per game against Virginia’s 80.9 generates near-parity on offense, though the 73.6 to 68.3 points-against differential favors the ACC representative.
Virginia’s 29-5 record and 17-4 ACC mark reflect Tony Bennett’s system execution: 46.1% shooting, 37.1 rebounds per game, and 6.2 blocks demonstrate defensive infrastructure. The 70-74 loss to Duke in the ACC tournament final showed vulnerability against elite competition, though the 84-62 win over Miami and 81-74 victory over NC State demonstrated tournament readiness.
Wright State’s 23-11 record and Horizon League championship provide the automatic bid, with Marques Cooper’s 13.2 points per game and Makail Imariagbe’s 7.0 rebounds offering statistical anchors. The 103-90 win over Northern Kentucky and 90-61 victory over Cleveland State showed offensive ceiling, though the 66-63 win over Detroit Mercy in the tournament final indicated late-season contraction.
The spread-to-total ratio produces manageable mathematics for the underdog: Wright State must lose by fewer than 12.7% of total points expected. Virginia’s pace-adjusted defensive efficiency typically suppresses opponent scoring by 8-12% below season averages, implying a final in the 65-80 range if the Cavaliers execute their system.
Neutral-site conditions at the Xfinity Mobile Arena in Philadelphia reduce Virginia’s home-court advantage, though ACC tournament preparation at similar venues provides relevant experience. The total of 145.5 sits 5.4 points below the combined season scoring averages, pricing in defensive engagement that Wright State’s 48.7% shooting may challenge.
Virginia’s 10-4 record in the final 14 games includes three single-digit wins against conference opponents, suggesting late-season competitive compression that may extend to tournament play. The 18.5-point spread assumes maximum execution from a team that has shown recent variability.
Value Pick: Wright St Raiders +18.5 (-116)
Summary & Consolidated Value Assessment
The early Friday slate presents four distinct market structures. Value concentrates in the middle-market games where efficiency metrics contradict spread assumptions: Santa Clara and Akron both possess superior offensive efficiency and defensive metrics to their favored opponents, with spreads compressed by conference reputation and public participation patterns.
The market’s heaviest pricing – Arizona and Virginia – both present historical value on the underdog side, where large spreads in tournament conditions generate second-half substitution dynamics that favor the dog. The total of 149.5 in the Arizona game and 145.5 in the Virginia game both sit raw pace expectations below, suggesting market recognition of these dynamics.
Consolidated Value Picks:
- Santa Clara Broncos +3.5 (-119): Efficiency parity with superior recent form
- Akron Zips +7.5 (-109): MAC champion with superior offensive efficiency metrics
- LIU Sharks +30.5 (-109): Structural tournament dynamics in 1-16 matchup
- Wright St Raiders +18.5 (-116): Pace and defensive variance against the Virginia system
The structural edge across the slate favors the underdogs with demonstrable efficiency credentials, particularly where market pricing reflects conference bias over performance data.
Market data reflect consensus odds as of March 20, 2026, 2:54 AM EDT. Odds and prices are subject to change.